Interactive Videos
(Multiple Choice Question Shown at 2:38)
Learning Plan
Overview
In this lesson, we will explore the economic housing models of homeless people, explaining the choices individuals make when faced with limited funds and government housing policies. The importance of this topic lies in its ability to demonstrate how well-intentioned policies might inadvertently contribute to the problem of homelessness, suggesting that improvements in housing policies could provide practical solutions to homeless people. We will also present a real-world study conducted by the University of British Columbia, which gives cash directly to homeless people. This research provides evidence of the effectiveness of such cash transfers in reducing days being homelessness and achieving government-spent savings. However, it also notes the limitations in improving overall well-being. Overall, we first provide a theoretical framework to understand the choices and policies affecting homelessness, and then offer empirical evidence on how cash transfers would mitigate the issue of homelessness.
Lesson Objectives
By the end of this lesson you will be able to:
- Understand the Economic Model of Homelessness, and know how this model explains the choices made by homeless individuals, such as the trade-off between housing and other necessities.
- Understand the unintended consequences of well-meaning housing policies such as minimum dwelling size requirements.
- Recognize the function and limitations of charitable shelters in providing temporary relief to homeless individuals.
- Know the outcomes of a real-world study conducted by UBC that used cash transfers as a potential solution to homelessness.
- Understand the concept of cash transfers as a dignified method of aid for those experiencing homelessness.
- Propose ideas and recommendations based on the lesson’s content for addressing homelessness more effectively through policy changes and social interventions.
Read/Watch
–Lectures on Urban Economics by Jan Brueckner – 7.4 Homelessness and Policies to Correct It
–We gave $7,500 to people experiencing homelessness – A real research about housing supply for homeless people done by UBC
–UBC study: What happens when you give homeless people $7,500? – (1 min) – A video from Global News
Content
For further analysis of the homelessness housing policies, we first denoted:
- q = housing consumption, which also is q = y/p – c/p
- c = consumption of everything else
- p = price per unit of housing
- y = income of the low-income household
- Budget constraint is c+pq = y
We start analyzing the model with the following graph,

The homeless person maximizes utility subject to a budget constraint, thus the highest indifference curve must touch budget line at bottom, where q=0. We can also see from the graph that the steep indifference curve indicated the consumer is very reluctant to give up c. They require a lot of q to give up a little c.
The reluctance is mainly due to alcohol, drugs, and mental illness, indicating the housing consumption is a much lower priority compared to getting enough food.
Let’s consider how a Proportional Rent Subsidy Program will affect the homelessness.
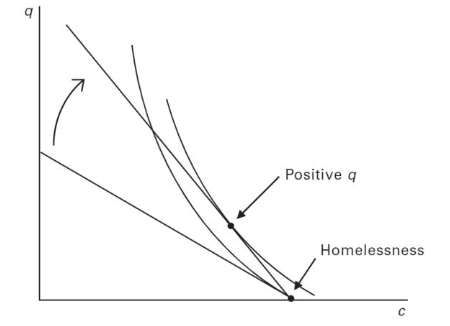
Under the Proportional Rent Subsidy Program, the government pays a potion of the household’s rent. However, the consumers have the same income to devote to c if they did not spend on housing, so the intercept at y does not change. Thus the budget constraint rotates upward. Now we can see the highest indifference curve is tangent to the budget constraint at a point where q>0.
What if there are limitations stipulate by housing regulations such as minimum dwelling size requirements?
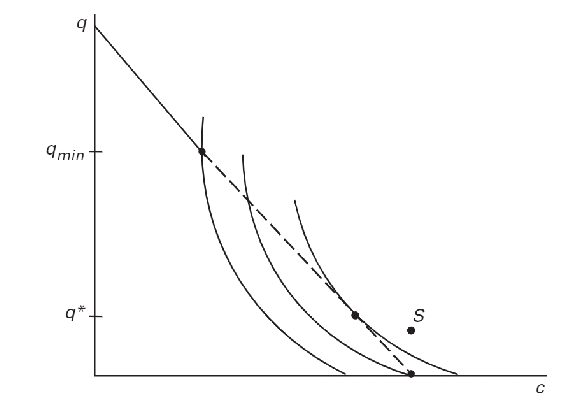
When housing regulations require a min q, the dashed line is not attainable. They only gives the homeless person two options, consume qmin or q=0. The second option is on a higher indifference curve, so consumer choose to be homeless.
What if a charitable organization provide shelter to address homelessness? If they provide shelter at zero cost, the consumer can consume point S on the above figure.
Application
- Learners can engage in policy development by using their understanding of economic models and empirical research to advocate for changes in housing regulations, accommodating the housing needs of low-income individuals.
- Learners can organize workshops or create informational campaigns that highlight successful outcomes such as direct financial assistance.
Reflection
- What are the advantages and disadvantages of provding shelter to address homeless people? Why do some of the homelessness not use charitable shelters even the cost is zero?
- How do economic models help us understand the decision-making process of individuals who are homeless?
- What are the potential risks and benefits of reducing housing regulations, such as minimum dwelling sizes?
- What are the long-term social costs of not addressing the affordability of housing?
- How might the findings from the UBC cash transfer study influence future policies and programs aimed at reducing homelessness?
- How can we ensure that well-intentioned assistance programs do not have unintended negative effects on the homeless population?
To Do List
- Answer one or two questions in reflection.
- Review the economic model of homelessness, and write down the reason for the rotation of indifference curves when the PRS program implemented to homelessness.
- Present how government policies might inadvertently contribute to homelessness.
- Compare and contrast the theoretical models discussed in the content with the empirical findings in the UBC study.
- Discuss how new insights into housing supply might influence future policies or personal perspectives.
Reference
- Brueckner, J. K. (2011, September 9). Lectures on Urban Economics. MIT Press.
- We gave $7,500 to people experiencing homelessness — here’s what happened next – UBC Department of Psychology. (n.d.). UBC Department of Psychology. https://psych.ubc.ca/news/cash-transfers-to-people-experiencing-homelessness
- Global NEWS. (n.d.). Retrieved November 22, 2023, from https://globalnews.ca/news/9933830/give-bc-homeless-people-7500-study/
Merrill’s Principles of Instruction
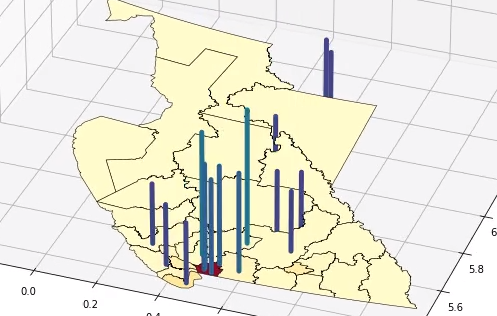
I would like to use Merrill’s Principles of Instruction to design a lesson around the research result of visualization of 3D time series data on a 2D map to effectively show the spread of a virus. The lesson will be centered around a real-world problem – understanding and visualizing the spread of a virus. This is particularly relevant in the context of global health crises like the COVID-19 pandemic. It addresses the need for an understanding of epidemiological data.
I used Python to write a function to show how 3D time series data can be plotted on a 2D map. Though Python isn’t interactive, we can design our own 3D time series function to show the visualizations of data.
I would also like to create tutorial videos showing the Python scripting process and how it translates data into visualization. Summarizing key steps to control the 3D time series data function is extremely important to process real-world data sets.
Leave a Reply
You must be logged in to post a comment.